Is your eCommerce store a leaky bucket? You spend a fortune on ads, SEO, and social media to drive traffic, but your sales stay stubbornly flat. It’s a common and deeply frustrating problem. You’ve likely scoured the internet, finding endless “top 10 tips” lists that offer generic advice but no real strategy, leaving you to guess at what might move the needle.
This article is different. This isn't another checklist. This is the exact, repeatable framework we use at Kensium—our internal agency playbook—to diagnose revenue leaks and drive measurable growth for our clients. We’re pulling back the curtain on the step-by-step process that covers diagnosis, optimization, and measurement.
This isn’t theory. This is the same process we used to help a legacy brand like Kingsley North, a leading supplier to the lapidary and jewelry-making community, transform its digital experience. Throughout this guide, we’ll use their story to show you how this playbook works in the real world, diagnosing critical friction points—from a poor mobile experience to a high-friction checkout—and turning traffic into profit.
What is eCommerce CRO? (And Why It's Your Biggest Growth Lever)

Conversion Rate Optimization (CRO) in eCommerce is the systematic process of increasing the percentage of website visitors who complete a desired action—most importantly, making a purchase. It’s not about guesswork or randomly changing button colors. It's a disciplined practice of understanding how users navigate your site, what actions they take, and what’s stopping them from converting.
To start, you need to know your number. The formula is simple:
(Number of Conversions / Total Number of Visitors) x 100 = Conversion Rate %
So, what is a good conversion rate for an eCommerce store? Industry benchmarks suggest an average rate between 1% and 4%. However, this number varies wildly based on your industry, price point, traffic source (email vs. social media), and device (desktop vs. mobile).

The real power of CRO eCommerce lies in its financial impact. You’ve already paid to acquire your traffic; CRO maximizes the return on that investment. The potential gains are staggering. According to extensive research by the Baymard Institute, the average large-scale eCommerce site can achieve a 35% increase in conversion rate through better checkout design alone.
“CRO isn't about chasing trends; it's about understanding your specific customer's friction points and systematically removing them to build a better, more profitable experience.” – Head of CRO at Kensium
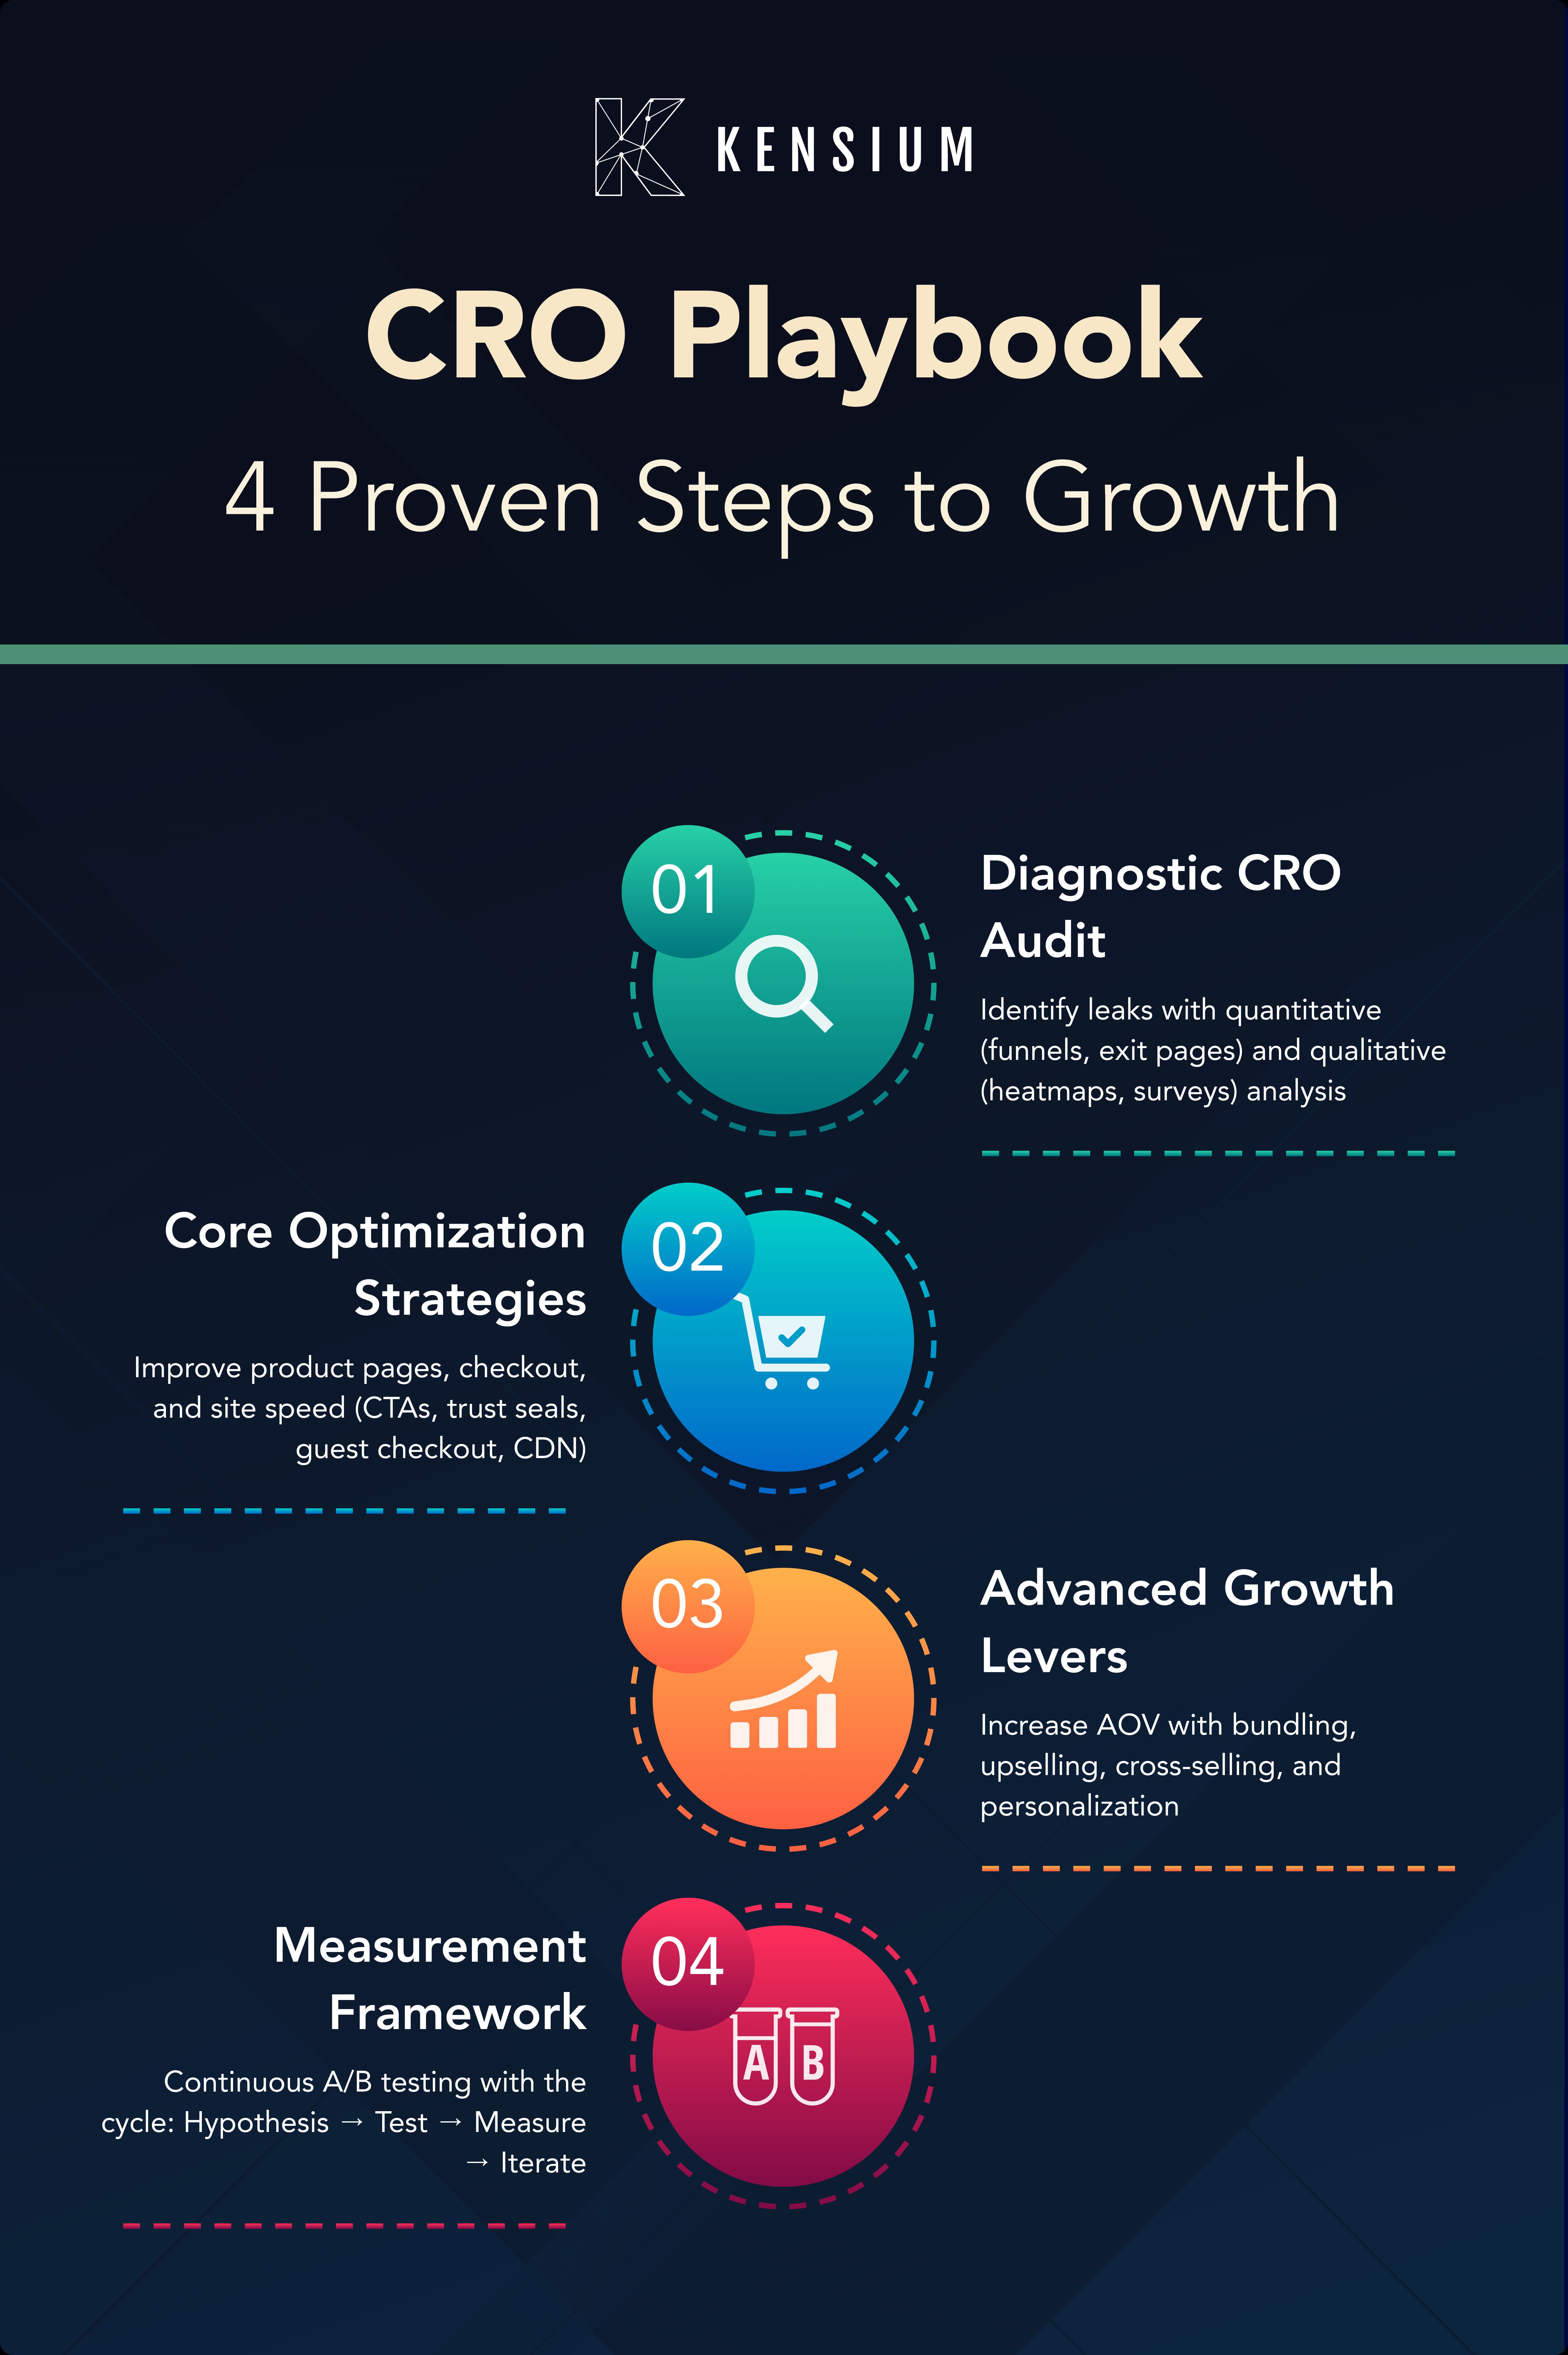
The Kensium Playbook, Step 1: The Diagnostic CRO Audit
The most common mistake in eCommerce is prescribing solutions before diagnosing the problem. You wouldn't take medicine without knowing what's wrong, so why would you redesign your product page without data? This is why the first and most critical step in our agency playbook is the eCommerce CRO audit. It’s how we move from "I think this is the problem" to "I know this is the problem."
An audit is a comprehensive analysis of your website to identify conversion barriers and find your biggest revenue leaks. It’s a process that combines hard data with an understanding of user behavior. This is exactly how we began the Kingsley North CRO project, uncovering the key friction points that were hindering their growth.
To help you get started, we’ve created an Agency-Grade DIY CRO Audit Checklist that you can download and use to begin your own diagnosis. This process is broken down into two key parts.
Quantitative Analysis: Following the Data Trail to Find Leaks
Quantitative analysis is about using hard data to find out what is happening on your site and where the problems are. Using a tool like Google Analytics, you can become a detective, following the data trail to uncover leaks in your conversion funnel.
Start by looking at these key areas:
- Conversion Funnel Analysis: Map out the primary path users take from landing page to completing a purchase. Tools like Google Analytics' "Funnel exploration" report will show you exactly where users drop off. For Kingsley North, our funnel analysis revealed the highest drop-off occurred at the billing information stage, a major clue that pointed to issues with form fields or trust.
- High-Exit Pages: Identify the pages where users most frequently leave your site. If your top exit pages are product pages with a high bounce rate, it suggests a problem with your product information, pricing, or call-to-action.
- Device Segmentation: Analyze your conversion rate on desktop versus mobile. This was a critical finding for Kingsley North. While their overall conversion rate was an average 2.1%, segmenting the data revealed a massive gap: desktop users converted at 3.04%, while mobile users converted at just 1.35%. This immediately told us the mobile experience was a primary source of lost revenue.
- User Flow: Trace the paths users take through your site. Are they going back and forth between product pages and category pages, unable to find what they need? This could signal problems with your site navigation or information architecture, a core part of Customer journey mapping.
Qualitative Analysis: Understanding the 'Why' Behind the Clicks
Once your quantitative data has shown you where the problems are, qualitative analysis helps you understand why they're happening. This is where you move beyond numbers to observe real user behavior and gather direct feedback, which is essential for any user experience (UX) audit.
Key methods include:
- Heatmaps and Scroll Maps: Tools like Hotjar or Microsoft Clarity generate visual reports showing where users click, move their mouse, and how far down a page they scroll. A heatmap might reveal that users are clicking on an image that isn't a link, indicating a design flaw. For Kingsley North, scroll maps showed that most mobile users never scrolled past the first 30% of a product page, meaning they never saw critical CTAs or product details.
- Session Recordings: Watch anonymized recordings of actual user sessions on your site. This is one of the most powerful ways to build empathy and spot friction. For Kingsley North, we watched users repeatedly hop between similar product pages, revealing confusion caused by unclear product names and a lack of comparison tools. We also saw users "rage-clicking" on non-interactive icons and text, a clear sign of a frustrating UX.
- User Feedback & Surveys: Don't be afraid to ask your users directly. On-site polls, exit-intent surveys ("What stopped you from purchasing today?"), and post-purchase surveys can provide direct insight into user pain points. For a more structured approach, consider formal user testing, which you can learn more about in the Baymard Institute's Guide to E-Commerce User Testing.
The Kensium Playbook, Step 2: Core Optimization Strategies
After your diagnostic audit has revealed your site's biggest opportunities, it's time to implement solutions. This step focuses on the core areas of your eCommerce site that have the most significant impact on revenue.
Product Page Optimization: Turning Browsers into Buyers
The product page is where a purchasing decision is made. If it fails to convince, you'll suffer from a low add to cart rate. The goal is to answer every potential question and build desire for the product.
- The Problem: Visitors browse product pages but don't add items to their cart. This is often due to poor imagery, unconvincing descriptions, or a lack of trust.
- The Solution: A high-converting product page must include:
- High-Quality Visuals: Use multiple high-resolution images and, if possible, a product video. Show the product from different angles and in a real-world context.
- Compelling Copy: Don't just list features; sell benefits. Explain how the product solves a problem or improves the customer's life. Use clear, scannable formatting with bullet points.
- Prominent Call-to-Action (CTA): The "Add to Cart" button should be instantly visible, with a contrasting color that makes it stand out.
- Social Proof: Display customer reviews and ratings prominently. Shoppers trust other shoppers more than they trust you.
- Playbook in Action: Our audit of Kingsley North revealed that users were confused by similar products and couldn't easily find key information like warranties or manuals. To fix this, we recommended implementing horizontal tab navigation on product pages to organize information cleanly, making it easier for users to find specs, reviews, and other details without endless scrolling.
“Great product copy doesn't just describe the item; it places the customer in a story where the product is the hero that solves their problem. Focus on the 'after' state—how will their life be better with this product?”
To help you apply these principles, you need to focus on product page optimisation to audit your own pages.
Checkout Process Optimization:
A confusing checkout process is the number one conversion killer. eCommerce stores lose millions every year in sales due to cart abandonment. This is the final, most critical step, and any friction here is catastrophic.
- The Problem: A high percentage of users add items to their cart but abandon the purchase during the checkout flow. Baymard Institute research confirms that 17% of shoppers abandon their purchase simply because the checkout process was too long or complicated.
- The Solution: Simplify, build trust, and remove all friction.
- Offer Guest Checkout: Forcing users to create an account is a major barrier. Make guest checkout the most prominent option.
- Reduce Form Fields: Only ask for the information you absolutely need to process the order. Use features like address autocomplete to make it even easier.
- Show Progress: Use a clear progress bar so users know where they are in the process and how many steps are left.
- Display Trust Seals: Prominently display security badges (SSL certificates) and accepted payment logos (Visa, PayPal) to reassure users their information is safe.
- Playbook in Action: This is where we identified a major revenue leak for Kingsley North. Our diagnostic audit revealed that the highest user drop-off occurred at the billing stage. Qualitative analysis showed this was due to a lack of trust signals (like security badges) and a frustrating form layout. By recommending a simplified form, adding secure payment markers, and making guest checkout more prominent, we provided a clear path to fixing their 44.5% cart abandonment rate.
Improving Website Speed: The Silent Conversion Killer
In eCommerce, speed equals revenue. A slow, clunky website doesn't just frustrate users; it actively costs you sales and hurts your SEO rankings. This is especially true for mobile responsive design where users are less patient.
- The Problem: Your website takes too long to load, causing users to bounce before your products even appear.
- The Solution: Focus on the three pillars of speed optimization.
- Image Compression: Large, unoptimized images are the most common cause of slow eCommerce sites. Use tools like TinyPNG to compress image file sizes without sacrificing quality.
- Browser Caching: This technique stores parts of your website on a visitor's browser, so it doesn't have to reload everything on subsequent visits.
- Content Delivery Network (CDN): A CDN is like having mini-warehouses for your website's data all over the world. It serves your site's assets from a server physically closer to the user, dramatically speeding up load times.
- Playbook in Action: The motivation for this is clear. According to data from Google cited by Shopify, a one-second website speed improvement can increase conversions for mobile users by up to 27%. For a client like Kingsley North, whose mobile conversion rate (1.35%) was less than half their desktop rate, optimizing site speed is not a minor tweak; it's a critical business imperative.
The Kensium Playbook, Step 3: Advanced Growth Levers
After addressing the fundamental leaks in your store, the next step is to focus on advanced strategies—the ones that truly separate a good eCommerce store from a great one. At this stage, it’s not just about fixing problems; it’s about unlocking growth. These strategies are designed to proactively boost revenue from the traffic you already have, which is exactly where experienced Shopify CRO experts/agencies put their focus.
Increasing Average Order Value (AOV): More Revenue Per Customer
Conversion rate isn't the only metric that matters. Increasing your Average Order Value (AOV)—the average amount each customer spends per transaction—is a powerful way to boost revenue without needing more traffic.
- The Problem: Your customers are buying, but they're only buying one low-priced item at a time, limiting your overall profitability.
- The Solution: Strategically encourage customers to add more to their cart.
- Product Bundling: Group related products together and sell them as a package for a slight discount (e.g., a "Beginner's Kit").
- Upselling & Cross-selling: On the product page or in the cart, suggest a more premium version of the product (upsell) or complementary items (cross-sell).
- Free Shipping Thresholds: Calculate your median order value and set a free shipping threshold slightly above it to encourage customers to add one more item to their cart.
- Playbook in Action: For Kingsley North, whose products range from small tools to large equipment, building trust is key to encouraging larger purchases. Our recommendations included highlighting warranty information more clearly, adding cross-sell suggestions for compatible accessories, and promoting financing options to reduce the friction of a high-ticket purchase, all strategies aimed at lifting AOV.
Website Personalization: The Right Message at the Right Time
Personalization involves tailoring the shopping experience to the individual user based on their behavior, location, or purchase history. When done right, it makes the customer feel understood and increases the relevance of your offers.
- The Problem: Your website shows the same generic message to every visitor, from a first-time browser to a loyal repeat customer.
- The Solution: Use data to create a more relevant experience.
- Product Recommendations: Show "Recently Viewed Items" or "Customers Also Bought" sections.
- Personalized Promotions: Use pop-ups or banners with offers based on the user's location or the items they have in their cart.
- Behavioral Targeting: Allows businesses to deliver personalized content and offers based on a user’s past actions, preferences, and browsing behavior, increasing the likelihood of engagement and conversion
The Kensium Playbook, Step 4: Building a Measurement Framework
Conversion Rate Optimization is not a one-time project; it's an ongoing process of improvement. The engine that powers this process is a structured measurement framework built on A/B testing. This is how you ensure that changes to your site are based on data, not opinions. For a complete overview of the mechanics, check out VWO's A-Z Guide to A/B Testing.
From Idea to Insight: The Hypothesis-Driven A/B Testing Process
Every test should start with a clear, data-informed hypothesis. This framework turns testing from a gamble into a scientific process.
A strong hypothesis follows a simple template:
"By [making this change], we believe we will [achieve this outcome] for [this user segment] because [of this reason]. We will measure this by [tracking this metric]."
Example: " By changing our product page CTA content, we believe we will increase clicks by 10% for mobile users because clearer, action-oriented messaging will drive stronger engagement. We will measure this by tracking the add-to-cart rate."
“One of the biggest mistakes we see is calling a test too early. You must run a test for at least one full business cycle—typically one to two weeks—to account for daily fluctuations in user behavior and get clean, reliable data.”
The Essential eCommerce A/B Testing Tools
To run tests, you'll need the right tools. The best choice depends on your platform, technical expertise, and budget.
- Best for Beginners: Many platforms have built-in or easy-to-install apps. For example, Shopify has several A/B testing apps in its app store that require no code.
- Best for Mid-Market: Tools like VWO and Convert offer powerful visual editors and advanced targeting capabilities without the enterprise-level price tag.
- Best for Enterprise: Platforms like Optimizely provide the most robust feature sets for large-scale, complex testing programs, including server-side testing.
Frequently Asked Questions (FAQ)
1. What's the first step if my mobile conversion rate is much lower than my desktop rate?
This is a classic sign of a poor mobile user experience. Start with a qualitative audit of your mobile site. Use session recording tools to watch how mobile users interact with your pages. Pay close attention to:
- Load Speed: Is the site slow to load on a mobile connection?
- Navigation: Is the menu easy to use with a thumb? Are buttons large enough to tap?
- Forms: Are checkout and login forms easy to fill out on a small screen?
- Content Visibility: Do users have to scroll endlessly to find the "Add to Cart" button or key product info? Fixing these usability issues is the fastest way to close the mobile conversion gap.
2. How can I tell if my product pages are confusing customers?
Review your analytics and session recordings for behavioral clues. Frequent ‘pogo-sticking’ — when users bounce back and forth between product pages — often signals that customers can’t clearly differentiate your products from the information provided.
It may be due to unclear product titles, similar thumbnail images, or a lack of clear variant selectors (e.g., size, material, model). To fix this, improve your product naming conventions and ensure key differentiators are highly visible "above the fold."
3. My checkout abandonment rate is high. Where should I look first?
Start by pinpointing the exact step where users are dropping off. In Google Analytics, a funnel exploration report can show you this. This tells you to focus your investigation there. Common problems at this stage include:
- Surprise Costs: Unexpectedly high shipping or tax fees are a top reason for abandonment.
- Lack of Trust: Missing security badges (SSL, McAfee) or payment logos (Visa, PayPal) can make users feel unsafe.
- Forced Account Creation: Always offer a prominent guest checkout option.
- Complex Forms: Are you asking for unnecessary information? Simplify your forms to the absolute essentials.
4. What are "dead clicks" and why do they matter for CRO?
A "dead click" occurs when a user clicks on a website element that they expect to be interactive, but nothing happens – e.g. where users click on images, icons, or text specifications expecting a link or pop-up.
Dead clicks are a direct signal of a frustrating user experience. They indicate a mismatch between your design and your user's intuition. They erode trust and can cause users to abandon a page or session. Use heatmap tools to identify where dead clicks are happening and either make the element clickable or redesign it to look less like a button or link.
5. Is a CRO audit a one-time fix or an ongoing process?
A diagnostic CRO audit is the foundational first step, but true conversion rate optimization is an ongoing process. The initial audit identifies the biggest "leaks" and provides a strategic roadmap for high-impact fixes.
However, customer behavior changes, new technologies emerge, and competitors evolve. The best practice is to move from the initial audit into a continuous cycle of testing and refinement (as outlined in Step 4). This "always be optimizing" mindset is what separates good eCommerce stores from great ones.
When to Call the Experts: Choosing an eCommerce CRO Agency
Executing this playbook takes time, resources, and expertise. For many businesses, partnering with a specialized eCommerce CRO agency is the fastest path to significant growth. But the industry can feel opaque. This section demystifies the process of finding and hiring the right partner.
What Does a CRO Agency Actually Do?
A true CRO agency does far more than just run A/B tests. A quality partner provides a comprehensive service that includes:
- Strategy: They develop a long-term optimization roadmap based on your specific business goals.
- Deep Research: They perform the full diagnostic audit outlined in Step 1, using quantitative and qualitative methods to find your unique opportunities.
- Design & Copywriting: Their team includes UX/UI designers and copywriters to create the new versions (variants) for testing.
- Development: They have developers who can implement the tests on your site, whether it's a simple change or a complex new feature.
- Analysis & Reporting: They analyze the results, provide clear reports on what was learned, and use those insights to inform the next test.
This is the key difference between a generalist marketing agency that "does CRO" and a specialist agency that lives and breathes it.
Conclusion
The path to a higher conversion rate isn't paved with random tactics and guesswork. It's built on a structured, repeatable process: Diagnose your specific problems with a data-driven audit; Optimize your core conversion points like product pages and checkout; Advance your strategy with AOV and personalization; and Measure everything with a disciplined testing framework.
This is the Kensium Agency Playbook.
It's a process that transforms your website from a leaky bucket into a fine-tuned revenue engine. The results speak for themselves. For Kingsley North, this exact framework diagnosed deep-seated user experience issues and created a clear roadmap for growth by improving trust, reducing friction, and paving the way for a more profitable future.
Ready to stop guessing and start growing? Implement the playbook yourself, or have the experts who built it do it for you.
Contact Kensium today to schedule your own diagnostic audit and unlock your store's true potential.
Sources & References
- Shopify. (N.D.). Why Site Speed Is So Important For CRO, SEO, and Loyalty. Retrieved from https://www.shopify.com/blog/site-speed-importance
- Nielsen Norman Group. (N.D.). 6 Tips for Successful Personalization. Retrieved from https://www.nngroup.com/articles/personalization/


.png)


.jpg)


