Today, distributors are facing enormous challenges like never before. Supply chain networks are exceptionally complex and unpredictable, and competition gets more challenging daily. In addition to the complex supply chain management, customers are expecting more and more from distributors. When you combine these challenges, profit margins are slim and slimmer. As a distributor, you know it’s critical to research and implements ways to shave costs, increase efficiency, and boost profits. The challenge is identifying the processes and functions that need to be evaluated and become more effective and efficient in the day-to-day operations.
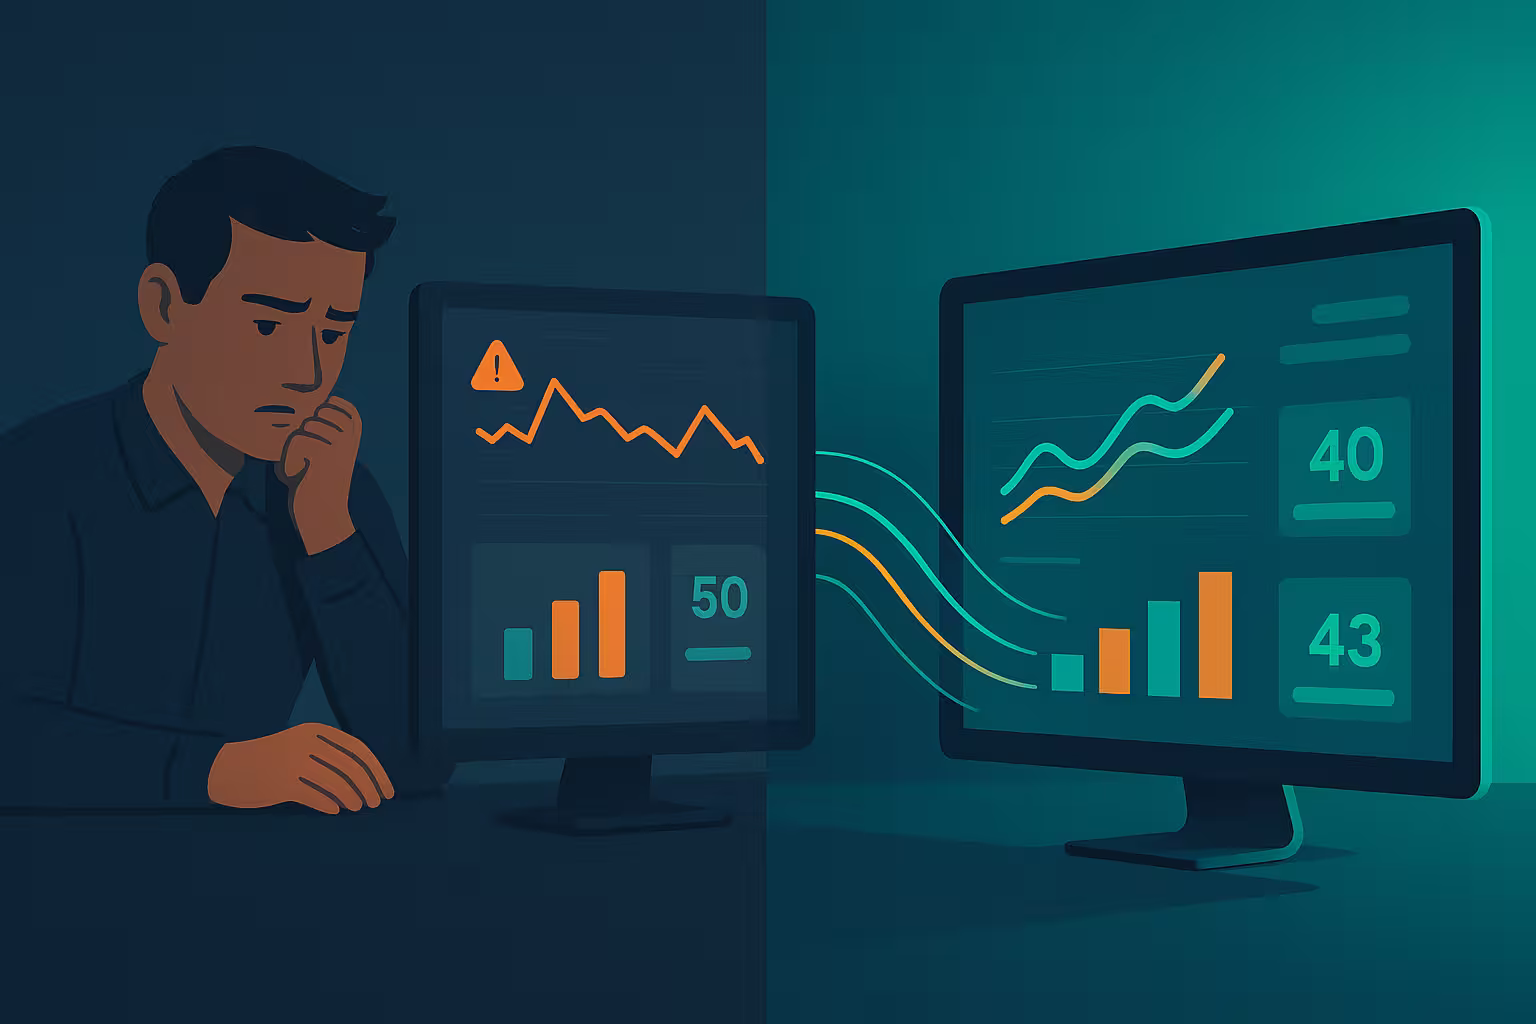
Using Key Performance Indicators (KPIs) helps you find areas for improvement and identify the need for new technology to help speed up your supply chain network. KPIs are driven by data provided by your ERP solution and highlight which processes are working well, determine target areas for improvement, and make informed decisions that boost your bottom line. But which KPIs show the most critical information? How do these metrics help you manage your supply chain and distribution management? We will review the key metrics to use and how they help improve efficiency and lower resource costs.
The Importance Of Metrics
We are in the golden age of business intelligence and KPIs. So we turned to our partner Acumatica to gather the industry-specific information for distribution KPIs to create this whitepaper. Since Acumatica tailors their solutions by industry, they are the experts in Distribution metrics to help revolutionize your supply chain management and back-office efficiency.
Today, technology allows us to connect with every part of our business processes. From sensors connected to equipment and smart devices, the Industrial Internet of Things (IIoT) gives unprecedented visibility to data and metrics on almost every process in your supply chain. Unfortunately, access to this data can overwhelm and confuse company decision-makers. There are so many metrics that it’s difficult to disseminate the numbers relevant to your goal and those that don’t bring value to your decisions. Thankfully, technology also provides solutions to alleviate information overload and find user-friendly analytics and data visualization tools that provide business intelligence to the right people at the right time.

When thinking of metrics and KPIs, you often think about historical measurements. These measurements summarize past events and data about a specific date range or time period. KPIs collect and compile the data into user-friendly forms that target a particular workflow, job function, or part of your supply chain. Still, there are additional KPIs that measure operations so you can focus on specific activities relative to your entire business model. Metrics like transportation schedules, inventory, on-time delivery, backorders, customer service, and more provide the critical data you need to increase productivity and find ways to make your processes more efficient.
You can use two types of KPIs to help manage your current problems and look to the future to be proactive instead of reactive when issues arise.
Historical KPIs
Historical KPIs are set up with alerts and warnings to monitor and detect exceptions, call attention to issues with graphical interfaces, things like green lights to indicate things are working as expected, yellow lights indicating a non-emergent problem, and red lights to show a broken process. You can also set up alert messages sent via email or SMS.
Predictive KPIs
Predictive KPIs are leading indicators that project performance expectations in the future. Managers use these projections to make decisions and take actions to avoid issues and enhance results. For the distribution industry, predictive KPIs are economic indicators, demographic trends, or industry-specific indicators like future product demands. They allow your company to be proactive and mitigate issues before they arise.
Key Metrics To Follow
Distribution Flow
Operational distribution KPIs track the overall business status and performance company-wide or in specific areas of operations. Each part of your distribution network can be monitored individually or combine multiple factors into a single report. Some of the key areas you can track are:
- Inventory
- On-time shipments
- Profitability
Depending on your needs, you can set these reports up for a single warehouse or section of the supply chain or group business categories together for a more significant amount of data to analyze.
Inventory Turnover
Inventory turnover refers to the time between an item purchased by a company until it is sold. A complete turnover means the company sold the purchased item, minus the things lost to damage or shrinkage. Tracking low and high turnover items is critical to managing your distribution costs. In addition, collecting data for these items helps a purchasing manager watch for open POs and purchasing trends. With this information, you find ways to minimize damage and fraud during the purchase lifecycle and increase profits.
On-Time Delivery
This metric is a KPI that distributors use to assess the ability to fulfill orders by promised delivery dates. The On-time Delivery ratio divides the total number of orders delivered by the number of deliveries that arrived after the promised delivery date. Most companies measure on-time delivery for a specific date range. For example, if an item is due to deliver on July 1st, you can consider it an on-time delivery if it arrives between June 27th and July 1st. If it comes after July 1st, it’s considered late. Separate warehouses or multiple warehouses can view On-time delivery ratios to get an overall picture of your delivery times and where you can make improvements.
Profitability by Item
This class of financial metrics evaluates a business’s ability to generate earnings relative to revenue, operating costs, shareholder equity over time, and balance sheet assets. The KPI data is collected from a specific point in time and compared with your efficiency ratios. Profitability ratios show how well your company uses internal assets to generate income. The higher the ratio, the more favorable it is. But these ratios provide more information compared to results of your company’s historical performance, ratios of similar companies, and the industry average.
Getting Started With KPIs
Acumatica’s Executive Information System comes with predefined KPIs right out of the box, and it’s not a bad place to start. However, these predefined KPIs are a starting point to measure business operations and efficiency, but over time, you’ll need to customize these reports to meet your specific business needs. As you become more proficient in creating custom KPI reports, you’ll start proactively solving problems and minimizing the issues that keep you from increasing profits.
KPI Management And Maintenance
Once you’re fluent in Acumatica reporting, the next step is managing and maintaining these reports to ensure accuracy and update metrics as your business grows. Your business needs continually change, customer preferences change, and markets change. Take advantage of the technology you use to keep up with the changes and understand how these changes impact your business.
The great news is that Acumatica ERP’s flexible, adaptable, and user-friendly dashboards. Because the dashboards are built with the end-user in mind, anyone with access can make changes and create new reports that provide a more granular view of your KPIs. The Acumatica Distribution Management module is cloud-based, so information is available on any device, anytime, or anywhere. It is built for real-time updates and flexibility, so your KPIs are dynamic and responsive, providing relevant data for fast decision-making.
Acumatica Distribution Management dashboards can link data sources together. For instance, you can connect your warehouse or transportation management system to outside resources like demographics, economic trends, and other factors that affect your business. Your KPI dashboard acts as the control tower for your business, gathering data from sales activity and forecasting, inventory management, procurement and/or production, and other factors to build a valuable view of every aspect of your business. Then, as you create more specific reports, you can focus on the most critical factors for success. Acumatica helps you collect, distribute, and communicate the successes and struggles across all departments, keeping users up to date on trends, potential issues, and areas of improvement.
Conclusion
While KPIs originated in large, complex organizations, their value is recognized for any size business. With the emergence of new and user-friendly technology, ERP systems make KPI analysis more powerful and flexible measurements affordable for smaller organizations. Historical KPIs focus on summarizing, presenting, and analyzing data commonly found in distribution management systems and relieve busy managers from the need to read endless reports and screens. Acumatica ERP has built-in tools to enable fast data analysis, user-managed alerts, and alarms to highlight activities and business areas that need attention, creating the ability to make better-informed decisions.
Predictive KPIs go a step further, uncovering conditions or actions that can adversely affect operations, allowing managers to address issues before creating losses. Predictive KPIs use current workflow patterns and external information to project future results like revenue, profit margins, workload, and backlogs to predict potential problems. Remember, KPIs can and should change as you make decisions that shorten the gap between profits and losses. Once you solve a situation and stabilize the workflow, the KPI is less important, and you’ll want to modify or replace the KPI to track the next critical issue. This is a crucial procedure to limit the growth of KPIs to a point where you have too much data and not enough time to find a solution. The ideal number of KPIs to watch regularly is between 8 and 10.
Finding The Right Implementation Specialist
KPIs are a critical business management tool that is both powerful and easier to use thanks to business intelligence and executive information applications part of a comprehensive ERP system like Acumatica Distribution Management. While once implemented, it’s a user-friendly system. However, you’ll need help implementing and integrating it with your front-end system. That’s where Kensium comes in. We are experts in understanding your business needs and creating solutions to power your business now and in the future. Contact us today to discuss how Acumatica Distribution Management can help you minimize losses and increase profits.
.png)


-small.jpeg)